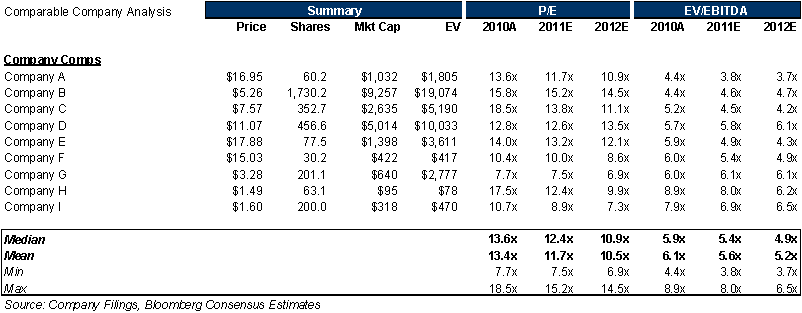
Comparative Company Analysis (usually called “Comparable” or “Comps” on the street) is one of the major company valuation analyses done in investment banking. This is a relative valuation method meaning you will be comparing financial metrics against similar firms in the company’s industry. In this exercise we will break down the steps in selecting the universe of “comps,” locating the necessary financials used, spreading the key trading multiples, and determining valuation.
The other major valuation methodologies include Precedent Transaction and Discounted Cash Flow.
Step 1: Selecting the Universe of “Comps”
The purpose of comps is to value the company by examining the financial ratios of relevant peer groups. The first step for your comparative company analysis (aka “Comps) is to find similar companies that operate in the same field as the company you are trying to value.
This is usually done in one of two ways:
- Your investment banking deal team or Managing Director (MD) will instruct you what comps to use: i.e. your MD might say, “Use the following 10 companies in this analysis.” Management usually has the best insight into the true competition in the market and is usually the one best resource, BUT it’s the investment banker’s job to figure this out on their own.
- You do a run using bank resources that search and screen for relevant criteria’s you input.
You will never find a perfect comp because no company is ever 100% similar, but you will be able to narrow down your search using the following characteristics:
- Sector
- Products & Services
- Customer
- Distribution Channel
- Geography
Good comps include “Pizza Hut and Domino’s,” “Home Depot and Lowe’s,” or “Pepsi and Coca-Cola.” These are very similar companies within a similar geography, services, customers, and distribution channel.
Step 2: Locating the Necessary Financials
Once you have your universe sorted of publically traded comparables, your next step is finding the necessary financials that will be used to spread your multiples. Bankers will use database resources such as Capital IQ and Factset in order to pull this information quickly. This will be checked against the actual GAAP data released in company 10-Qs and 10-Ks that must be filed with the SEC at sec.gov.
Usually necessary financials include:
- Earnings per Share (EPS)
- Market Capitalization (Stock Price x Shares)
- Enterprise Value (Market Capitalization + Net Debt)
- Earnings before Interest, Taxes, Depreciation, and Amortization (EBITDA)
- Total Revenue
There is no better source than using public filings on sec.gov. This will take longer pulling this information by hand vs. a database but it’s the best way.
Step 3: Spreading the Key Trading Multiples
The next step after collecting your comp universe and locating the necessary financials is to start “spreading” (banker lingo) the key trading multiples. This is simply organizing the information so that you can easily see valuation across your custom defined universe.
You will be analyzing comparable multiples such as
- Enterprise Value / Sales
- Enterprise Value / EBITDA
- Stock Price / EPS
Exhibit taken from the DCF Model (Comps included in the file):
Step 4: Determining Valuation
The final step once you have spread the multiples for your custom universe is to use this information for determining valuation. Using the information in step 3 above, you will use the financial multiples of your universe to determine the valuation of your company.
For example, if your company is predicting to have EBITDA of $200 million in 2010 and the comp universe is trading on average at 10x 2010 EV/EBITDA then your company would be worth approximately $2 billion.
Check out another article on “Comparable Company Analysis” that walks through a real-life example.
Other interesting articles:
