Now that we have been through the frameworks/analytical methods frequently used to solve Case Study questions, as well as a discussion of the main categories of Case Study questions that are asked, it’s time to practice solving Cases.
The six Street of Walls Business Situation Case Study examples provided in this chapter are outlined in a manner that would reflect a real case. In many other guides, the Cases are presented in a much cleaner way, often applying specific frameworks with little explanation of or exploration into the thought process behind solving them. Often, these guides present all of the information up front, whereas in a real Case Study interview, the candidate will often have to ask follow-up questions to get the needed information. In short, real Case Study interviews at firms are never straightforward, and interaction with the interviewer generally involves jumping around various business concepts but tying together your responses in a thoughtful, articulate, concise, and accurate manner.
When you read through these Cases, take time to pause and think about what your next steps would be. Which questions would you ask? How would you process the response? At what point would you begin performing analysis? At what point would you begin offering recommendations or hypotheses? Go through the guide slowly and deliberately, pausing to see what you’d do next. Then compare your thoughts with the following lines. When you’re done, see where you could have improved your thought process and what you would have done differently now that you know the ending of the Case. Practice this method repeatedly, and you should find that your performance on these Cases and your confidence begin to improve dramatically.
Also be aware that many Cases will not have a clear-cut answer. The important thing in such Cases will be your ability to articulate your understanding of the key issues, make recommendations/form perspectives that are appropriate, and give guidance for what additional information and analytics you would like to perform to assist in making the decision clearer.
Here are a few additional tips before you get started:
- Before diving in to the example Case Studies, be sure you have reviewed our discussions on frameworks/analytics for Consulting Case Studies as well as Consulting Case Study Types from previous chapters. The concepts and structures outlined in these chapters will be a useful reference tool as you practice cases. We see it as a mini, strategy-focused, MBA in only about 20
- When you read these Business Situation Cases and the suggested approach for responding to them, you will see that most are common sense—but that this common sense develops over time and with practice, reaching ever-greater levels of understanding and sophistication.
- This is a valuable skill for you to develop not only for the Case Studies, but also for your Consulting career. Being able to identify the key issues and structure your response to a business problem well is important for the Case Studies, but it is just as important in the daily life of a Consultant.
- It is worth noting that the business concepts and situations highlighted in these examples do overlap, but most real-world business situations (and also most Case Study interview questions) will also include a range of business issues to address, even if there is only one core problem being asked about. For example, a company bringing a new product to market will require market size analysis, but will also a competitor analysis and industry landscape, as well as a good understanding of the customer segments.
- As you practice Cases, you should rehearse responding out loud, not just in your head. You will find that you begin to speak more articulately and competently about business, regardless of whether you secure a position at a Consulting firm. This will be valuable in your career no matter what you do!
Note: by convention, Case descriptions, interviewee questions, and interviewee responses are written in normal text, while interviewer responses to interviewee questions are written in italic text.
OK, let’s get to it!
SOW Business Case Example #1
To Co-Work or Not To Co-Work: New York City
There is an increasing trend of co-working in New York City, fueled partly by the technology boom. Co-working spaces are communal work places, which freelancers and small companies can use as workspaces, while sharing the space with any number of other freelancers and/or small companies. As part of the arrangement, many resources, such as office equipment and bathroom and kitchen facilities, are also shared.
Fred Wilson of Union Square Ventures explains the trend well:
“The main benefits of this kind of setup are camaraderie (small start-ups can be lonely), knowledge-sharing, high energy, culture, and cost sharing. I have heard many stories of software developers walking to the other side of the office to talk to software developers working for another company to talk about a thorny tech issue. That same thing can happen in finance, legal, business development, marketing, product management, really all parts of the business. You can get some of the benefits of scale without being at scale.”
Matt and Tony are two real estate entrepreneurs who want to capitalize on this trend, and start New Work Labs, a co-working space that fits 75 people. They are in talks with two office buildings to lease out the space. The first one is a building near the young and trendy Union Square area, which will be $40 per square feet per annum. The second building is in the SOHO/Chinatown area, in an old loft surrounded by dumpling shops at $30 per square feet per annum.
Which building should they select?
Data List and Questions
- How much space is needed for 75 people?
- Normal office allocates 200-225 sq. ft. per employee. However, co-working spaces in New York can be as dense as 100 sq. ft. per person.
- What is the total investment required to set up the space?
- Plain vanilla build-out and retrofitting will cost $50 per square foot.
- Furnishings will cost $20 per square foot.
- Assume total build-out for Chinatown space is 30% cheaper than Union Sq.
- What are the utilities and maintenance costs (this includes everything, e.g. electricity, wifi, water, heat, repairs to furniture, security, etc.)?
- $10,000 per month.
- Do they need to hire someone?
- Yes, an office manager at $70,000 per annum total compensation.
- What will be the rental for these desks?
- $300 per month per person for monthly usage.
- $30 per day for daily usage.
- Assume that 1/3rd of total occupancy is for daily desks.
- No weekend hours.
- For simplicity, assume flat rates without any deals.
- What is the occupancy rate?
- Co-working spaces have been found to quickly reach 70% occupancy rate on average.
- The Union Sq. location will have a higher occupancy (assume 80%). Chinatown will see average occupancy. (Note: Bonus points for assuming that Union Square might see higher occupancy rates.)
- Are there any additional revenue opportunities?
- Co-working spaces double up as event spots during evening hours. Average rate for an event is $5,000.
- To avoid disrupting the regulars too much, a space holds no more than 6 events on average every month. (Note: Bonus points for asking this question. Also, bonus points for considering that Chinatown may have a harder time getting to 6 events per month.)
- How long do Matt and Tony want to do this?
- They would ideally exit in less than 10 years. (Note: Bonus points for asking this question.)
Key Items Tested in Case
- Calculate the build-out costs.
- Calculate the operating costs.
- Generated revenues must exceed operating costs. This tests a candidate’s creativity to maximize revenues, and allow him/her to explore additional avenues. Take account of consideration for the community, which may mean letting go of some money generating opportunities.
- Which building offers a faster payout? This must be seen in light of earnings run rate, therefore also see which building will offer a better exit opportunity in 5-10 years.
Sample Calculation
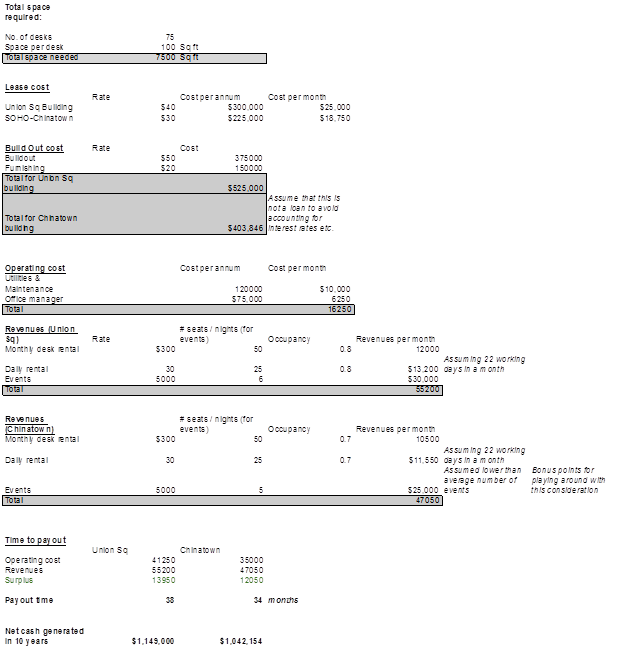
(Note that during the case, you would need to do this on paper and estimate to some degree. You may even want to concentrate mostly on the differences between the two offices to gain a perspective on which facility to rent.)
Takeaways
- The Union Square office takes longer to repay the initial investment but generates more income n an ongoing basis. Ignoring discounting, the Union Square office offers more income potential over a 10-year time frame.
- The decision is a close one, however, and is largely driven by assumptions about the relative occupancy rates and the number of events per month.
- If, in fact, the number of events per month is the same in each office, then the Chinatown facility dominates the Union Square facility (less investment and more cash flow per month).
SOW Business Case Example #2
Telecom Company: Growth Opportunities
Assume that the year is 2006, and the largest Indian Fixed Line Telecom Co., Telca, which has global ambitions, wants to double its Revenue over the next 5 years. To meet this aggressive target, its strategy team scanned the universe for acquisition targets and identified two options:
- SeaLink, the largest undersea cable provider on the Trans-Atlantic route
- Afmob, the largest mobile telephone service provider in Africa
You have been hired as a Consultant to help Telca pick the most ideal option—the company cannot acquire both. The following Exhibits are available. How would you go about this project?
Exhibits
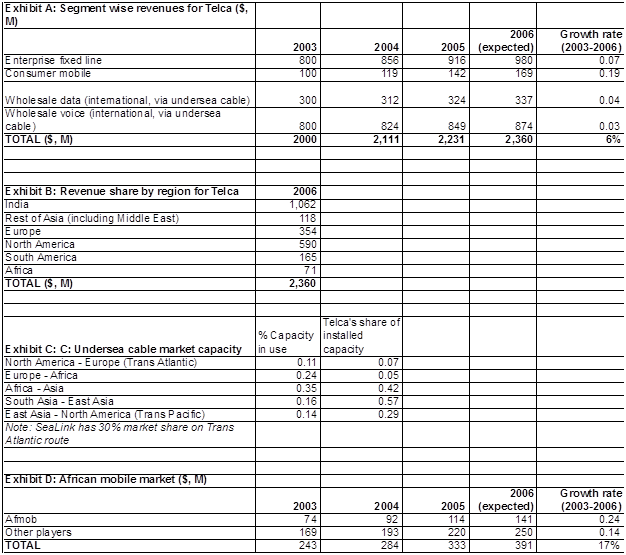
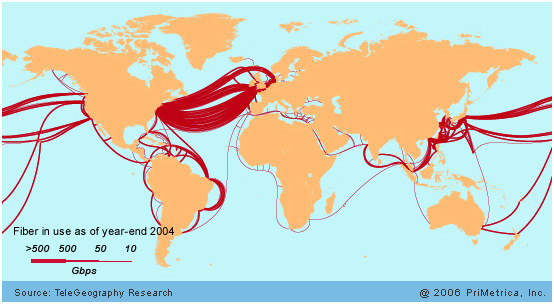
Exhibit E: Undersea cable map
Initial Response/Key Issues
The key is to quickly analyze and realize from the data that the two choices present completely different growth strategies: expand in a mature, crowded market closer to the core strength of the Company (SeaLink) or in a rapidly-growing market where the Company has limited experience (Afmob). Either strategy can be justified.
A sample thought process is outlined below, including some questions for the interviewer:
Exhibit A questions and inferences
- Enterprise fixed line and wholesale voice/data are the primary business segments for Telca.
- Consumer mobile is growing fast, but is still a small share of the total
- Q: Is wholesale data and voice for Telca carried on the same international cable?
- A: Yes—the same is true for SeaLink.
Exhibit B questions and inferences
- Primary markets for Telca are domestic (India), Europe, and North America.
- Limited presence in Africa and the rest of the world
- Q: What does a region’s revenue mean for wholesale data/voice—particularly with regard to international calls?
- A: This is the location where the sales originated.
Exhibit C questions and inferences
- Q: What does the “% Capacity in use” figure represent?
- A: Undersea cables have more capacity than what is currently being used. This is similar to your computer’s hard disk. The figure represents the total for voice and data combined.
- Q: Telca’s shares are listed in terms of the proportion of installed capacity; what about its shares for “% Capacity in use”?
- A: Assume a split equal to that of the whole market.
- Telca has a dominant position in Africa–Asia, South Asia–East Asia, and East Asia–North America (Trans-Pacific) routes (assume probable #1 position for all). It has marginal status in North America–Europe (Transatlantic) and Europe-Africa.
- Sealink’s acquisition will make Telca the #1 player in the wholesale data/voice business in each of the major routes.
- There is significant unutilized capacity in Transatlantic. This means that even if a player has dominant market share, it cannot control pricing because other players will simply light up additional unused capacity.
Exhibit D questions and inferences
- The African mobile market is exploding, i.e., growing at 14% annually.
- Afmob is growing even faster, i.e., it is gaining market share and is already the dominant player.
- The overall market is relatively small at the present time.
Exhibit E questions and inferences
- Illustrates Exhibit C data visually while also giving visual inferences to the magnitude of each route’s relative market size/capacity.
Takeaways
- SeaLink’s acquisition strengthens Telca in its core business.
- However, the core business is slow growing and facing a capacity glut.
- Mobile is not the core business for Telca but is the fastest growing market.
- Telca has limited experience in running a mobile business, and no experience in running it in a foreign environment.
- Afmob’s acquisition will give Telca a foothold in the fastest growing high potential market.
- In your response, you should take a position after carefully reviewing all of the evidence. There is reason to believe that either acquisition could be better. Afmob provides entry into a new, fast-growing market in which Telca has limited exposure, but the market is still small and the move has a number of strategic hurdles to face. Meanwhile, SeaLink is a leading player in Telca’s core business, serving routes in which Telca has marginal-player status. This market is not growing rapidly, and there may be pricing pressure due to the substantial unused capacity.
- A good follow-up to your conclusion would be to highlight areas of research to help make a better informed decision, such as:
- Profitability of each business
- Quality of management at each business
- More detail on Competitor landscape, including pricing trends and market positioning
- Relative cost to acquire each business
- Technological or regulatory risks (and in the case of Afmob, potential political risks)
- Current Revenue for SeaLink
- Remember, however, that the key goal of this case was Revenue growth, not Profit. One could reasonably infer from the Exhibits that, if pricing per volume is similar at SeaLink to Telca’s pricing, that SeaLink is likely to have much more current revenue than Afmob. In that case, an acquisition of SeaLink immediately gets Telca much closer to its stated goal.
SOW Business Case Example #3
Mind That Heat: Sticky Labels
Sticky Inc. manufactures heat-shrink labels. You might recall noticing these labels on Arizona Tea or 5 Hour Energy bottles–they are completely wrapped from head to toe and have 360 degree graphics printed on them. This is achieved through label sleeves that shrink by applying heat to conform to the shape of the bottle. This makes handling and storage of the labels tricky. Label materials can start shrinking at temperatures over 90 degrees Fahrenheit.
Sticky Inc. is struggling to decide whether to manufacture these labels in China or the U.S. and is soliciting your assistance to help the company make an informed decision.
Data List and Questions
- What is the price of these labels?
- 30 cents per Thousand Square Inches (MSI) (Note: M is often used as a symbol representing 1,000).
- Where are the customers located?
- 100% in the United States.
- What does it cost to manufacture them?
- 16 cents per MSI in China.
- 20 cents per MSI in USA.
- Who pays for the transportation cost from warehouse to customer?
- Sticky Inc. (technically, this cost is baked in the price, but Sticky Inc. has limited ability to pass on any increase in this cost because the competition might not follow).
- What is the transportation cost?
- 3 cents per MSI when being transported from China (assume the warehouse cost in the U.S. is baked into the manufacturing cost).
- 2 cents per MSI when transported from within the U.S.
- Are the warehouses temperature controlled?
- Yes. All the costs are baked into the manufacturing cost.
- Is the transportation temperature controlled?
- No. Transportation costs do not account for it. (Note: This is the most important question. Bonus points for asking it in some variation, and serious negative points for not identifying it.)
- How much extra does it cost to transport in reefer (refrigerated) containers?
- Transportation cost doubles.
- When is refrigerated shipping required?
- During the summer is an obvious assumption. Assume April to September, i.e., 6 months for US manufacturing. (Note: Bonus points for considering using temperature control year-round on shipping in China, as the climate tends to be fairly hot there year-round.)
- What are the other costs (e.g. sales, marketing, G&A, etc.)?
- 6 cents per MSI for both options.
Sample Calculation
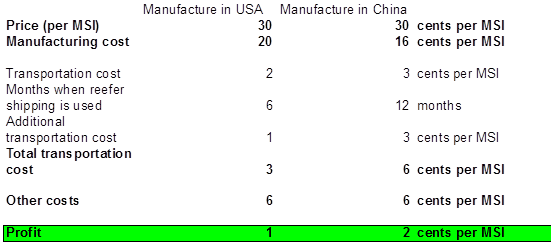
(Note that during the case, you would need to do this on paper, although you should be able to calculate these numbers exactly. You may even want to concentrate mostly on the differences between the two manufacturing and shipping plans, and use these differences to estimate the cost savings of one option vs. the other. However, doing so will make it more difficult to perform sensitivity analysis around the assumptions, and to calculate the exact profit amount for each scenario.)
Takeaways
- Overall, manufacturing is 4¢ cheaper in China but shipping is at least 1¢ more, ignoring reefer shipping.
- Assuming half of U.S. shipping and all of China shipping requires refrigeration, this adds 1¢ to U.S. shipping costs per MSI and adds 3¢ to China shipping costs per MSI.
- At first glance, our calculations indicate that manufacturing in China is probably cheaper by a fairly small margin (saving 1¢ relative to total manufacturing + shipping costs in the U.S. of 23¢).
- Note, however, that we have omitted an important consideration: items like these run a serious risk of inviting high duties and/or anti-dumping fees in U.S.
- Additionally, the company may receive some backlash for shipping manufacturing operations to China. This consideration is hard to quantify, but may be enough of a factor alone to sway the decision.
- The best candidates will evaluate the answer in light of these considerations.
SOW Business Case Example #4
Food for Cruise: Miami
FoodCruise Inc. runs a four-day/four-night cruise out of Miami. The cruise line has always prided itself upon the quality of the dining and the experience on board. Traditionally, cruise lines had a single dining hall with a pre-set menu, with fixed seating at a fixed time twice per day for each of the travelers, who were expected to dress in a formal manner. FoodCruise currently operates its on-ship meals in this fashion.
FoodCruise realizes that this practice is not appropriate for the free-spirited nature of many individuals who are seeking an exciting yet relaxing cruise experience. The Company is contemplating the elimination of the dining hall to introduce 10 restaurants, each serving a different cuisine. Restaurants will serve an à la carte menu, and each passenger will be given a voucher of $200 to be utilized over 8 meals. Any purchase above this amount will be charged. Industry experts and competitors are keenly watching this innovation.
The CEO of FoodCruise hires you and asks, “Is this a wise move for our company?”
Data List and Questions
Overall, the key is to figure out the additional cost for FoodCruise to operate 10 separate restaurants, relative to its current dining setup, and determine whether it will help the Company win enough incremental customers to justify the cost.
- How many passengers are typically on board a cruise ship?
- The capacity is 500.
- Occupancy has suffered due to the large number of cruise lines and recent economic weakness, so assume average occupancy of around 60%.
- What price does an average traveler pay?
- The price is $1,000 for the standard four-day/ four-night cruise.
- How many trips does one ship make in a year?
- 20 is the company’s average.
- What was the cost of food per passenger for the dining hall?
- $100 is the typical cost per passenger for the whole trip.
- What was the profit per ticket?
- 10% of revenue, or $100 per customer, is the company’s current profit margin.
- Does FoodCruise need more manpower to operate 10 restaurants instead of 1 dining hall?
- Yes, it needs 10 more staff members; the average fully-loaded annual compensation per staff member is $72,000. You can ignore any upfront costs associated with building out the restaurants on the ships.
- For the restaurants, what is the expected bill per passenger per meal?
- Average across each restaurant is expected to be $40.
- For simplicity, assume consistency across lunch and dinner.
- What about tipping?
- In both the options, no individual tipping is encouraged. A lump sum tip is expected at the end of the cruise, which is distributed to the entire crew. No increase is expected in the total tip amount.
- Is the food cost expected to increase under this proposed plan?
- Yes, assume 20% more to account for the additional pre-prepared food required for individual restaurants. Because there are more dining options that are varied, there will be more food wastage. (Note: Bonus points for asking this question.)
- What is the additional CapEx (Capital Expenditures) required to set up these restaurants?
- Again, we are ignoring any upfront costs for the build-out of the restaurants, so you can ignore CapEx for this analysis. (Note: Even though the answer was “ignore,” add bonus points for remembering to think of this, because usually CapEx considerations will apply.)
Sample Calculations
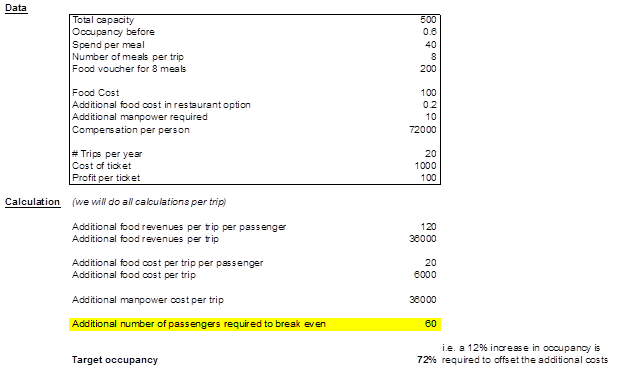
(Note that during the case, you would need to do this on paper, although you should be able to calculate these numbers exactly. You may even want to organize your work differently—note, for example, that the additional manpower is fixed per trip. Therefore, each passenger is worth ($120 – $20) = $100 of incremental profit. Since the incremental fixed cost per trip, from increased staff size, is $36,000, this means we need 360 passengers to breakeven, or 72% occupancy rate.)
Takeaways
- As per sample calculations, a 12% increase in occupancy is required to offset the additional operating costs, given that all of the assumptions are correct.
- Try to note which assumptions are the most fragile. For example we are assuming an average food spend of $40 per meal by customers. If this drops to $35, then the marginal value of each customer under the new plan falls from $100 to $60. In that case, even at 100% capacity the plan is a money-loser.
- If, by contrast, the actual spend averages $45 per meal, then the marginal value of each customer is $140, and now the break-even number of customers falls to 257 (51.4% capacity). In this scenario, it’s likely that the plan is a winner.
- A strong candidate will weigh the probability of winning new customers under the baseline assumptions ($40 per meal) vs. the potential competitive response.
- Whether there is a “first mover advantage” that will sustain the customer win is a smart topic to discuss, as first move does not necessarily lock in customers for the future. If, for example, competitors immediately copy FoodCruise’s plan, this will almost certainly negate FoodCruise’s ability to maintain higher-than-industry occupancy rates.
- Given the low occupancy rates across the industry, if competitors implement this plan, it may also lead to a “voucher war” in which there is a push toward higher and higher voucher values needed to attract customers. Hence FoodCruise may start out giving $200 vouchers, but may end up feeling pressure to increase this to $225, $250, etc. in order to attract customers, depending on what the competition does.
- Also notice that we’ve ignored initial Capital Expenditure requirements entirely. In reality, it is very unlikely that these costs can be ignored. Furthermore, these expenditures will take time to implement.
SOW Business Case Example #5
Chip The Kart
Disclaimer: This is a fictitious case, which only uses a real life premise. All data is hypothetical, and has no relation to actual/official data for Amazon Inc. or ChipKart.
Amazon Inc. has been considering an India market entry for some time, although it has been skeptical of the adoption of credit cards and the migration to online shopping in India. Meanwhile, a local start-up company, ChipKart, has emerged, and created a strong, well-reputed Indian e-shopping market. It overcame the reluctance to use credit cards online through the simple innovation of accepting Cash on Delivery (COD) for its merchandise. ChipKart trained the delivery & logistics team to become a part of the sales process.
This innovation has awoken Jeff Bezos, CEO of Amazon Inc., to the possibility of market potential in India. However, leery of engaging in an early, head-on battle with ChipKart, Mr. Bezos decided that he would like to know which are the right customer segments and product segments to target for initial entry into the India market without arousing a competitive battle with ChipKart early on.
You have been hired as a Consultant to help Amazon make a decision on what direction to take. How will you go about it?
Exhibits
Initial Response/Key Issues
Looking at the Exhibits, you can probably already note that this is a complicated business situation. The key is to recognize that there are different purchasing trends among the different demographic groups, and that those differences have significant strategic implications.
A sample thought process is outlined below, including some questions for the interviewer (or just to ponder as your review the information):
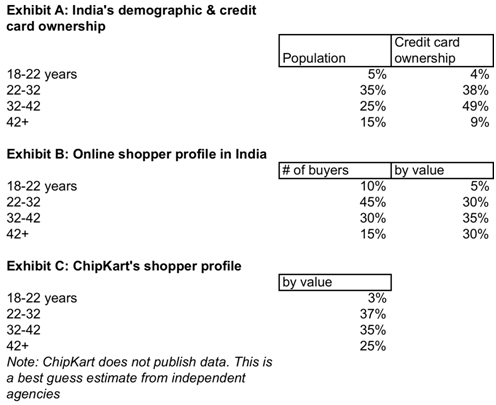
Exhibits A & B questions and inferences
- Note that 22-32 and 32-42 age customer segments have good credit card penetration. However, the younger end of the spectrum appears to be lower-price focused.
Exhibit C questions and inferences
- Something peculiar is going on with ChipKart. Against conventional wisdom, the 22-32 age group seems to be purchasing a larger amount than would be expected, by value.
- Note that both ChipKart and the overall market skew heavily toward older segments, when transactions are measured by value rather than quantity. In both cases, this suggests that the older population is buying more items per order or more expensive items.
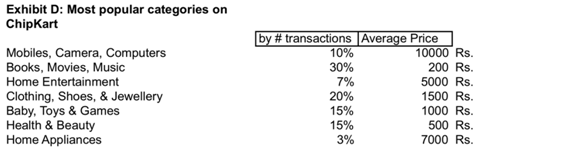
Exhibit D questions and inferences
- It would have been useful to have this data by value, but we can gain a sense of Revenue by category by multiplying the number of transactions by the average price. According to this metric, the highest-revenue categories are:
- Mobiles, Camera & Computers
- Home Entertainment
- Clothing, Shoes & Jewelry
- This could help confirm our suspicion. The products that the older segment could potentially buy are most likely the higher-priced items.
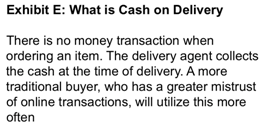
Exhibits E, F & G questions and inferences
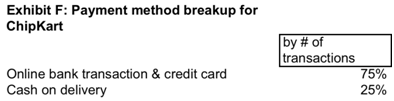
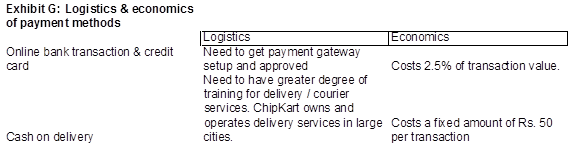
- COD is prohibitive for smaller value items. Is this passed on to the consumer? Who buys the smaller value items? (It may be difficult to incorporate the COD cost in the price of the item without losing the revenue to a competitor, either online or in a physical retail store.)
Takeaways
- It might be challenging to set up cash on delivery (COD) initially (Exhibit G). It requires finding, hiring, and training a network of delivery personnel, and setting up oversight to ensure respectable quality control.
- Cash on Delivery economics do not work for certain products (Exhibit D and Exhibit G), and these products make up the lion’s share of the transactions in India. Relative to online bank and credit card transactions, COD shipping loses money on shipments below 2,000 Rs. in value. (Above 2,000 Rs., the COD method is less expensive, ignoring setup costs.)
- Looking at demographics, one can deduce that older (42+) customer segments buy items more suitable for Cash on Delivery (they are purchasing higher-value shipments on average, and are much less likely to own credit cards).
- A potential answer could be: Amazon should target younger segments with cheaper items, and place an emphasis on high-volume purchasing. It should allow only bank and credit card transactions.
- The data is ambiguous in some respects, however, and some of the conclusions we’ve drawn from it may be misleading. Thus this Case probably has no definitive answer, and there are a range of qualitative and quantitative issues that could be brought up from the Exhibits, as highlighted above. Such a case can lead into a discussion about many topics not directly related to the specific Case.
SOW Business Case Example #6
Narnia or Neverland
Axia Inc. is a communication equipment company based out of the Greater New York Area. It has been facing rising Costs with limited ability to increase Revenue, and the company’s bottom line (Profit Margin) has suffered as a result. The company just won a new large contract, however, and is seeking to supplement the existing software development team at the company with a remote outsourced software engineering team from another company to help facilitate the delivery of equipment mandated by this contract. The request is to hire a team of 150 engineers.
You have been hired as a Consultant by the senior management of Axia to determine the best outsourcing location. The decision is between two front-running choices: Neverland and Narnia. While making a recommendation for the outsourcing location, ignore the outliers. Assume that each country is representative of all firms in that country.
Exhibits
Initial Response/Key Issues
The key to this case is to notice that there are plusses and minuses to each country; therefore, there are multiple factors to take into account and there is likely to be no clear-cut best answer based on the information provided. Additionally, the information provided is limited.
A sample thought process is outlined below, including some questions for the interviewer (or just to ponder as your review the information):
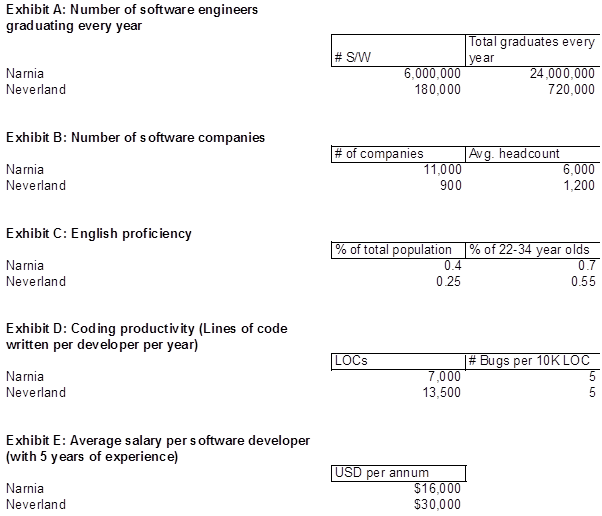
Exhibit A: Number of software engineers graduating every year
- Neverland is a much smaller country, though software engineering seems equally popular among its respective population (25% of annual graduates).
Exhibit B: Number of software companies
- Narnia seems like a traditional powerhouse, with many large companies. Is a 150-member team too small for it?
Exhibit C: English proficiency
- Could Axia engineers face problems in communicating with the team in Neverland? Overall it has a much lower English proficiency than Narnia (25% vs. 40%), although the majority of the younger population in both locations seems to be proficient in English.
- Narnia has an edge here, but if hiring is to be done among younger workers, that edge is less clear-cut.
Exhibit D: Coding productivity (Lines of code written per developer per year)
- Neverland appears to have much strong software engineering talent. Much higher LOC scores and much fewer bugs per LOC.
Exhibit E: Average salary per software developer (with 5 years of experience)
- That’s a big cost difference. Is Neverland worth it?
Takeaways
- There are not many calculations involved in this case. Therefore it is essential to highlight the major issues.
- Narnia is a much bigger economy with far more firms of much larger size on average. (Since the requirement is only 150 engineers, it is possible that Neverland firms will be more eager for the business opportunity than Narnia firms.)
- In spite of this, Neverland still has a similar concentration of software engineers.
- Narnia has an edge in English proficiency, though it is too early to tell how important this factor will be—particularly if younger engineers are selected.
- Neverland has much more productive software engineers with a lower bug rate than Narnia, but also a much higher cost per engineer. Neverland is slightly less expensive on a per-output basis ($2.22 per line of code vs. $2.29 per line of code). Nevertheless, 2 software engineers from Narnia will produce about the same amount of code as 1 software engineer from Neverland, at roughly the same cost—but with twice the error rates!
- Other considerations not mentioned in the Exhibits, but worth considering and potentially asking about, include relative regulatory/technology/political advantages or disadvantages from working with either country. For example, one country may have a much better trade relationship with the U.S.
- Your answer could take many forms here. The key is to highlight the relative strengths of each location, and to justify a choice with sound business judgment. As discussed repeatedly in the interview preparation sections, it is most important that you are structured, thorough, and articulate in your thought process and answer/recommendations.
Additional Resources
We hope that you enjoyed and learned a lot from these sample Cases, and encourage you to review them again as you progress in your practice for Consulting Case Study interviews. We also recommend that you review the online cases offered by each firm, and some additional sample cases that we have included below. The more cases you do, the more confident and comfortable you will become at taking on any Case put in front of you.
Firm-Specific Practice Cases
- Bain Practice Case Studies (2 available)
- BCG Practice Case Studies
- Booz Interactive Sample Case Studies
- Marakon Practice Case Studies
- McKinsey Practice Case Studies
- Oliver Wyman Practice Case Studies (2 available)
Other Practice Cases
- Crack the Case System by David Ohrvall
- INSEAD Consulting Club Handbook (see pp. 54-108 for a detailed walkthrough of 13 different example cases)
Additionally, if you are currently enrolled in an undergraduate or graduate program, your school may have a Consulting Club. If so, this club should be able to provide you with additional practice Case Study questions.
←Consulting Case Study TypesConsulting Guesstimate Cases→