In this Leveraged Buyout (LBO) Analysis module we will cover seven key topics:
- LBO Overview
- Criteria for Selecting LBO Candidates
- LBO Capital Structure
- Building Operating Assumptions
- Potential Exits and Returns Analysis
- Sources and Uses
- Summary of LBO Considerations
LBO Overview
A leveraged buyout is the acquisition of a company, either privately held or publicly held, as an independent business or from part of a larger company (a subsidiary), using a significant amount of borrowed funds to pay for the purchase price of the company. The leveraged buyout transaction is orchestrated by a private equity firm (also called a financial sponsor) or group of private equity firms (also called a private equity group or a consortium), which will take ownership (own the equity of) the business after the acquisition has been completed.
The purchase of the company comes from a combination of equity capital (contributed by the sponsor/consortium, plus potentially some tag-along investors, such as management) and debt instruments (financed through banks and other lenders). Generally speaking, the debt will constitute a majority of the purchase price—after the purchase of the company, the debt/equity ratio is typically around 2.0x or 3.0x (i.e., usually the total debt will be about 60-80% of the purchase price).
In an LBO, the cash flow generated by the acquired company is used to service (pay interest on) and pay down (pay principal on) the outstanding debt. For this reason, while companies of all sizes and industries can be targets of LBO transactions, companies that generate a high amount of cash flow are the most attractive (more on this later).
The overall return for the sponsor or consortium in an LBO is determined by a number of factors:
- Growth in the operating profit/cash flow of the company (EBIT or EBITDA) over the life of the investment;
- The exit multiple on EBIT/EBITDA relative to the entry or acquisition multiple; and
- The amount of debt that is paid off over the time horizon of the investment.
Investment bankers typically use LBO analysis to obtain an LBO market value for a company. This can act as a “floor” for company valuation, because it provides a reasonable amount that financial investors (sponsors) would be willing to pay to own the company, whereas other investors may be willing to pay more for a variety of reasons. Other typical uses of LBO modeling include:
- Determining the equity returns (through IRR calculations) that can be achieved if a company is bought privately, improved, and then ultimately sold or taken public
- Determining the effect of recapitalizing the company through issuance of debt to replace equity
- Determining the debt service limitations of a company based on its cash flows
The vital steps in an LBO analysis include:
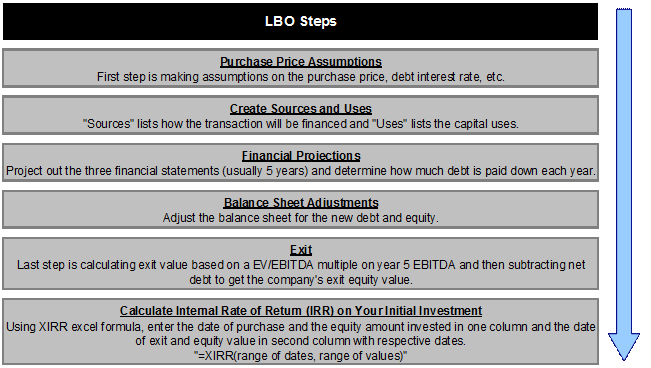
The key terms an anlayst should know know regarding an LBO are:

Criteria for Selecting LBO Candidates
A company capable of successfully undergoing an LBO typically possesses the following characteristics:
- Mature industry and/or company: The stock price of the target company is trading at a lower multiple to free cash flow than new companies in high-growth industries. This enables the LBO purchaser to buy the company at a relatively low cost compared to the annual cash flow it produces; this cash flow will be a key ingredient in generating an attractive return for the investors.
- Clean balance sheet with no or low amount of outstanding debt: Buyers need the ability to be able to use new debt, or “leverage” as the name suggests, as part of the acquisition consideration. Companies with high levels of pre-existing debt limit the amount of new debt that it can withstand, and new debt is crucial for the LBO. (Note that if a company has existing debt, that existing debt will often need to be refinanced in an LBO, because the financial sponsor will need to remove pre-existing financial covenants and limitations to fit the new capital structure.)
- Strong management team and potential business improvement measures: Management is capable of running the company effectively, and capable of creating a more efficient company (lower costs) or expanding into new profitable markets or products.
- Strong competitive advantages and market position: It is ideal if the company is in a good position within its market space (relative to current and potential competitors)—this will help shield the company from competitive pressures that might reduce profit margins (and therefore cash flows) and will help provide possible growth opportunities for the business.
- Steady cash flows: Stable, recurring cash flows are necessary, as that cash flow is needed every year to service the large debt burden for the LBO (especially in the first several years post-acquisition). Cyclical or highly seasonal companies, therefore, can run into trouble quickly if a downturn occurs. Debt pay-down is also important in that it increases the equity/total assets ratio of the company, boosting investor returns.
- Low future capital expenditure and working capital requirements: Part of the return LBO investors seek will be generated from growing the business, and growth costs cash in the short-term: growth must be used to finance new capital expenditures and new working capital requirements for the business. Therefore businesses that have relatively high capital expenditure and working capital requirements will be less attractive for an LBO.
- Possible sale of underperforming/non-core assets: Some companies that are purchased via LBO will have divisions or side businesses that are performing weakly or are a distraction to management. Often, these businesses can be sold to raise cash to pay off outstanding debt that is used in the purchase of the company. Note that these assets should not represent a significant portion of the company’s current cash flow: selling the business means losing that future cash flow, and cash flow is needed to pay off debt and interest.
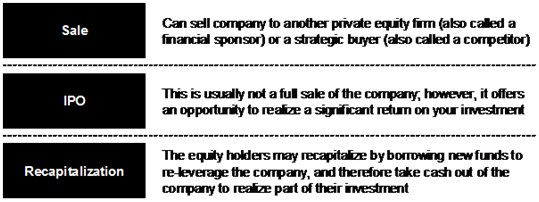
- Feasible exit options: Once the business has been improved and some of the debt used to purchase the business has been paid off, an LBO investor would generally like to exit—that is, sell—the company fairly quickly (a typical timeframe is 3-5 years after purchase). Holding the company beyond the optimal selling point will reduce the expected annual return on the investment, because leverage decreases every year. Therefore an analyst considering an LBO opportunity might want to consider how the company can be sold (typically via strategic sale to another company, an Initial Public Offering, or sale to another LBO investor). Any historical LBO, M&A, or IPO precedents in the LBO candidate’s industry might give an indicator as to how easily the company can be sold when it is ready for sale.
Capital Structure
While each leveraged buyout is structured slightly differently, there is a typical structure to the LBO that occurs on deal after deal (more or less). By this, we are referring to the components of the capital structure for the newly-purchased LBO company. Each component of the capital structure relates to a piece of the financing package that was used to purchase the company. Some deals might include a little bit more of one ingredient than another, or a “substitute” ingredient (such as one type of debt financing rather than another), but overall there is a fairly specific recipe that is almost always used.
Roughly speaking, about half (50%) of an LBO’s capital structure typically includes Senior Debt, also known as Bank Debt financing. Senior Debt is the “cheapest” of all of the financing instruments used to buy a company via LBO: it has a lower cost of capital than other tranches of the capital structure, as it is the first in line in the capital structure to receive value during a liquidation of the company. Thus it will typically have lower interest rates than other debt components of the company’s capital structure.
To be clear: if everything falls apart, the Senior Debt gets paid off first. Senior Debt has a priority claim on the cash flow of the business and is also secured by assets of the company. Additionally, Senior Debt lenders will typically stipulate strict limitations on the business—in essence, the business must meet certain performance criteria to be in compliance with the Senior Debt arrangements. These agreements are known as “covenants,” and they include minimum coverage of interest (the interest coverage ratio) and a maximum allowable debt/cash flow ratio. These performance ratios are typically scrutinized every quarter.
Senior Debt is generally fully amortized over a five to ten year period, which creates a burden on the company to generate sufficient cash flow from its operations to pay these debt balances off in that timeframe.
The typical pricing (interest rate) on Senior Debt is the LIBOR rate plus 200 to 400 basis points (bps). In addition, Senior Debt (like most debt instruments) will require closing fees in the form of financing fees plus an Original Issue Discount. These are effectively upfront charges paid to the lenders for the consideration of lending the company/sponsor the money to purchase the company.
High Yield Debt, or Subordinated Debt, often represents about 20% to 30% of the capital structure of the newly acquired company. High-yield debt has higher financial costs than senior debt. However, high-yield debt typically has less restrictive covenants or limitations and interest-only payments with pay down due upon maturity of debt. The high-yield debt issuers are ahead of the equity holders in the event of a liquidation of the company, but behind the Senior Debt. In other words, in a liquidation scenario, high-yield bondholders typically will not receive any compensation until the Senior Debt holders are paid in full. For this reason, High-yield bonds are often referred to as Junk Bonds, because the potential loss of investment capital is significant in many cases, and the bonds have little security for the investors aside from the cash flow generated by the company.
In many situations, high-yield debt is callable by the company after a few years, at a premium, which gives the company the option to obtain better terms on debt options, in the event that the company is doing well several years after the LBO occurs. This prepayment penalty (the premium) also offers protection to the high-yield bondholders: they agreed to lend money for a riskier debt instrument, and expect to continue receiving a high interest rate in compensation for having taken on this risk. Subordinated debt can also consist of various types of mezzanine financing, such as PIK notes, convertible preferred debentures, etc. Mezzanine financing is sometimes referred to as quasi-equity, or equity-like securities. These additional securities are typically smaller slices of the capital structure (usually around 5% apiece), and are junior to other forms of debt. They thus require an even higher expected return than other forms of subordinated debt, but decrease the amount of equity consideration the sponsor must contribute to purchase the company. By doing so, in a positive investment scenario for the equity holders, mezzanine financing usually increases the sponsor’s expected return. Indeed, the more high-yield and mezzanine financing used, the higher the equity returns for the sponsor are likely to be, because they reduce the sponsor’s required investment amount, but do not limit the potential gains to equityholders if the company increases in value.
Equity, which represents the private equity fund’s capital in an LBO, is the most junior tranche of the capital structure. In other words, common equity shareholders are paid last during a liquidation of a company, after all other stakeholders. The equity is typically around 20-30% of the notional value of the capital structure, though it is sometimes more for certain deals.
Because the company is so heavily leveraged at acquisition, equity holders require a large projected internal rate of return on investment—typically, investors seek annual returns in the range of 20% to 40%. Again, if problems occur during the investment, equity holders may very well receive no value on their position, particularly if the company defaults on its borrowed debt payments, so the required returns to compensate for that risk are high.
The following chart illustrates the various components of a typical LBO capital structure, organized from most senior to most junior, along with the approximate proportion of the capital structure that each tranche will represent:

Operating Assumptions
In order to assess how a company is likely to perform in an LBO, an analyst must forecast the projected performance of the company being acquired and, from this, determine how this will impact the value of each component of the LBO capital structure over the upcoming years. Financial projections, typically in the range of 5-10 years after the transaction close, act as the basis of the model. The core of the LBO model will reflect the concepts discussed in the Financial Modeling and Three-Statement Financial Modeling chapters in this training course.
Typically the CFO of an LBO candidate company will provide internal financial projections for the company developed by management. These projections can be assessed by the investor and possibly adjusted according to discretion to create alternate scenarios. If internal projections are not available, equity research analysts will often have reports available to help the analyst develop assumptions in the operating model, such as profitability margins and growth rates.
Key questions that an investment banker or private equity investor will confront when developing an LBO transaction analysis will generally include the following:
- What is the outlook for the company’s industry?
- Does the company operate in a cyclical or seasonal industry?
- What is the outlook for the current state of the domestic and global economy?
- How was the company affected in past recessions?
- To what degree does the company exhibit operating leverage—i.e., how much are profit margins affected by growth or decline in revenue?
The analyst must make sure that any assumptions made are realistic and include at least three scenarios (a “bullish” or optimistic case, a base case, and a “recession” or pessimistic case). For the base case scenario, the following guidelines are appropriate:
- Projected revenue should grow at a rate consistent with past performance.
- Projected EBITDA margins should be kept flat, or consistent with results from recent prior years. One way to do this is to use the average margins from the prior 3 years and use that average in the forecasted years.
- Working capital requirements should be projected at a constant percentage of revenue (or cost of sales) relative to recent prior years.
- Capital expenditures should grow at a slow rate, typically consistent with inflation.
Of course, depending on the specific circumstances of the company being analyzed, some of these base case assumptions might vary. For example, if the company is realistically expecting to switch to a lower-cost provider for its inventory, it may make sense to mildly decrease Cost of Goods Sold as a percentage of sales in projected years.
Once financial forecasts are built, it is vital to review the overall results. Projections should seem realistic and not overly optimistic, with no “hockey sticks”—i.e., no line items that grow at a rapid rate in one year (typically the first projection year).
For more detail on building a leveraged buyout model, please see our Private Equity Training Module, especially the following chapters:
Potential Exits and Returns Analysis
All LBO acquisitions are made with the goal in mind of improving the company, paying down debt, and selling the company for a handsome profit. Thus it is important, when evaluating a potential LBO, to consider the exit opportunities that may be available for the company when the time is right, and an appropriate exit strategy should be developed. There are three typical exit strategies for a private equity LBO transaction, illustrated in the graphic below:
Most private equity investors require an expected return (called the Internal Rate of Return, or IRR) in excess of 25% to consider an LBO of a potential target company (though in some situations this can stretch down to 20%). Typically, senior members of the investment team will be required to make critical assumptions on the potential exit multiple (EBITDA and P/E) and the maximum amount of debt load the target company can handle to achieve such high returns without taking on excessive risk. Here is an example of how the amount of leverage affects the IRR of an LBO transaction scenario:
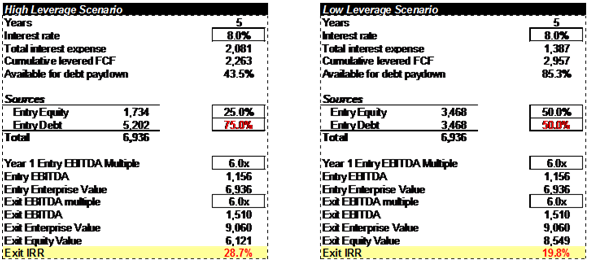
In the high-leverage scenario, we assume 75% of the acquisition consideration is borrowed money or various debt instruments, which may consist of a combination of senior debt and subordinated debt. This scenario gives us an expected 28.7% IRR. In the low-leverage scenario, we assume 50% of the acquisition consideration is borrowed money. The low-leverage scenario gives us an expected 19.8% IRR. Thus the low-leverage scenario is much safer—the value of the company (excluding debt paydowns) would have to decline by half for the equity value to be completely wiped out, while in the high-leverage scenario, a decline in company value by only 25% would wipe out the equity (at least in theory). However, the low-leverage scenario would produce returns that would probably be considered unacceptably low by a private equity investment firm.
Sources and Uses
In an LBO transaction, an investment banker or private equity investor is required to build a Sources & Uses table that lays out the pro forma adjustments that are made to the balance sheet of the underlying LBO target company. In effect, the Sources and Uses table traces the flow of money being used for various purposes to complete the transaction: the Sources of funds (lenders and equity investors) and the Uses of those funds (paying previous debt holders, previous equity holders, transaction fees, etc.). The sum of the Sources and Uses must be equal.
The following presents an overview of the Sources and Uses for an example transaction, including the required company Balance Sheet adjustments using purchase accounting. (Note in this graphic that blue data points represent input values and black data points represent formulas, or values that are calculated from other inputs):
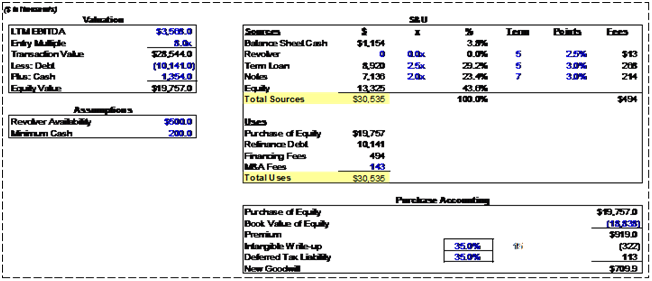
Let’s walk through this example table to understand what it represents. The “Sources” section lists how the transaction will be financed, and the “Uses” section lists the capital uses—i.e., the places that the money from the “Sources” section will be going. First, we calculate the Transaction Value and Equity Value of the target company:
and
$28,544 (Transaction Value) – $10,141 (Debt) + $1,354 (Cash) = $19,757 (Equity Value)
Note that the Cash is subtracted because when the company gets acquired, the Cash that it owns can be used to pay off existing Debt. This reduces the amount of pre-existing Debt the company has as of the time of the transaction—this figure (Debt – Cash) is called Net Debt. (Alternatively, you can think of company Debt as a Use of capital while company Cash is a Source of capital, and any Cash can be used to partially net out Debt as a Source.)
From above, we calculated the purchase Equity Value of the business. This Equity Value will be equal to the Purchase of Equity line item ($19,757) in the “Uses” section. Current Debt ($10,141) will also need to be refinanced, so this also is a use of capital.
In addition, the transaction will occur a series of fees. M&A fees, used to compensate advisors on the transaction, typically range from 0.5% to 2.0% of the Transaction Value. In this case, 0.5% of the transaction value ($28,544) is $143. Additionally, each tranche of the debt portion of the capital structure will incur fees. These financing fees (totaling $494) must also be included as a Use of capital.
Now, let’s take a look at the “Sources” section. Notice that the first line item, Balance Sheet Cash ($1,141), is different from the amount used to compute the company’s Equity Value (that Cash balance was $1,341). The difference arises from the “Minimum Cash” assumption included in the model—this is a reserve used to estimate the amount of Cash currently on the company’s Balance Sheet that it will be necessary to keep for its operations (paying suppliers and employees, making interest payments, etc.)
The next line item is the Revolving Credit Facility, or Revolver. The balance of this facility typically is zero at the beginning of an LBO transaction. The Revolver is a reserve of debt capacity that the company can use, like a credit card, to fulfill its cash needs if necessary. (This will especially be the case for seasonal companies, which might run at an operating loss for a portion of the year while making larger gains in the other parts of the year.)
Next are the Term Loan and Notes, which we calculate as a multiple of EBITDA:
- Term Loan: 2.5x (EBITDA multiple) × $3,568 (LTM EBITDA) = $8,920 (Term Loan)
- Notes: 2.0x (EBITDA multiple) × $3,568 (LTM EBITDA) = $7,136 (Notes)
Finally, we calculate Equity under the Sources section. Note that this is the equity that must be contributed by the private equity investor (sponsor), not the value of the equity being purchased: it is simply equal to the total of the “Uses” section less all of the other “Sources.” In other words, it is a “plug” that is solved for once everything else is known. Any capital needs for the transactions, as specified in the “Uses” section, that is not covered by another “Source” of funds must be covered by the sponsor.
As a footnote, the Financing Fees are calculated as follows:
- Revolver: $500 (Revolver Availability) × 2.5% financing fee as a percent of committed availability = $13.
- Term Loan: $8,920 × 3.0% financing fee as a percent of principal = $268.
- Notes: $7,136 × 3.0% financing fee as a percent of principal = $214.
The Financing Fees are then added up ($13 + $268 + 214 = $494 after rounding) and linked to the Financing Fees entry in the Uses section.
Next, we calculate the new Goodwill that will be added to the company’s Balance Sheet via an adjustment after the LBO is completed. The new Goodwill generated by the transaction is the Purchase of Equity ($19,757) less the current Book Value of Equity of the target company ($18,838). The difference is the premium ($919) paid to acquire the target company. We simply have to make one adjustment to this figure to get the final Goodwill figure.
Next, we calculate the Intangible Write-up (919 × 35% = $322). This is the portion of the Premium paid that we assume will be allocated to increasing the book value of intangible assets on the Balance Sheet. This is done at least in part to minimize the amount of Goodwill generated by the purchase of the company.
Next, we calculate the Deferred Tax Liability ($322 × 35% = $113). The Deferred Tax Liability (DTL) is incurred because the Intangible Write-up occurs on the financial statements, but on a tax basis (i.e., on the company’s tax statements), the value of the assets do not change. Over time the DTL will be amortized on financial statements as an expense, and this expense is not deductible for tax purposes. This difference will be unwound each year the Write-Up is amortized.
Now that we have that difficult concept explained: the new Goodwill is simply Premium minus the Intangible Write-up plus the Deferred Tax Liability: $919 – $322 + $113 = $710.
Once we have completed the Sources & Uses table and calculated the new Goodwill, we can make the necessary pro forma Balance Sheet adjustments to the company’s financial statements in the LBO analysis. The Goodwill of $710 and the Intangible Write-up of $322 will be added as assets in the pro forma Balance Sheet adjustments, while the Deferred Tax Liability of $113 will be added as a liability. Thus, the new Net Assets (Assets – Liabilites) added to the Balance Sheet = $710 + $322 – $113 = $919, exactly equal to the Premium paid for the company’s Equity relative to its book value.
Summary of LBO Considerations
The following graphic summarizes some of the most important high-level aspects of a typical LBO, such as strategy, multiples, covenants, and timing. All of these things must be taken into consideration by the analyst when constructing a proper LBO analysis model:
