In the Financial Statement Analysis chapter, we will cover five primary topic areas:
- Financial Statement Overview
- Income Statement
- Balance Sheet Statement
- Cash Flow Statement
- How Financial Statements Tie Together
Financial Statement Overview
What are Financial Statements, why are they important, and why do financial analysts use them?
Financial statements are formal records of the financial activities of a business. For a corporation with publicly traded securities, there are three primary financial statements that must be reported quarterly (4 times per year):
- Income Statement: Reports a snapshot of a company’s business performance over a period of time. This statement indicates how much revenue (sales) is generated by a business, and also accounts for direct product costs, general expenses, Interest on Debt, Taxes, and other expense items. The purpose of this statement is to show the company’s level of profitability, which is equal to a company’s Revenue net of its expenses.
- Balance Sheet Statement: Reports a snapshot of a company’s outstanding balances in various accounts at a specific point in time. The purpose of this statement is to demonstrate a business’s financial heath at any given time, by enumerating it assets as well as the claims against them (liabilities and equity).
- Statement of Cash Flows: Reports on all of the company’s activities that affect its cash position over a period of time. These activities are broken down into three primary categories: Operating, Investing, and Financing. The purpose of this statement is to give a detailed reconciliation of how the company’s Cash is being used (and how much Cash is being generated).
These financial statements all aim to provide an overview of a business’s performance and position, either over time, or at a given point in time. They are highly interrelated and must tie together perfectly. For example, in the Statement of Cash Flows, a detailed account of the change in a company’s Cash balances is given. This change must exactly match the change in Cash balances listed on the beginning and ending Balance Sheets for the Company. Similarly, many items in the Income Statement directly reflect changes in Balance Sheet accounts over time, and must match the changes there. More discussion of this concept can be found at the end of this chapter.
Financial statements are issued by companies and reviewed by the Securities & Exchange Commission (SEC). The SEC requires publicly-traded companies to file quarterly and annual results of operations. These are the summarized financial results of the company, and they are the backbone of financial modeling, company profiles and pitch book presentations. Without financial statements, most valuation work would be difficult or nearly impossible.
Locating Financial Statements
All publicly-traded companies are required by the SEC to file quarterly and annual reports. Private companies are not required to file financial reports, although some may have to if they have publicly traded debt. Company filings are found on the SEC’s EDGAR website.
Primary Information Found in Financial Statements (Forms 10-K & 10-Q)
- Management Discussion & Analysis
- Income Statement
- Balance Sheet Statement
- Statement of Cash Flows
- Notes and Exhibits to Financial Statements
Annual reports are filed as 10-Ks with the SEC and must be filed within 60 days of the company’s fiscal year end. 10-Ks are much more detailed than quarterly reports (10-Qs, discussed below), and contain information such as the company’s Business Overview, Risk Factors, Financial Data (Income Statement, Balance Sheet, and Statement of Cash Flows), Management Discussion & Analysis, and other important disclosures.
Quarterly reports are filed as 10-Qs with the SEC and have to be filed within 40 days of the end of the fiscal quarter. 10-Qs are less detailed than annual form 10-Ks but do provide helpful detail around the quarterly Financial Data (Income Statement, Balance Sheet, and Cash Flow), Management Discussion & Analysis, and other Company disclosures.
Income Statement
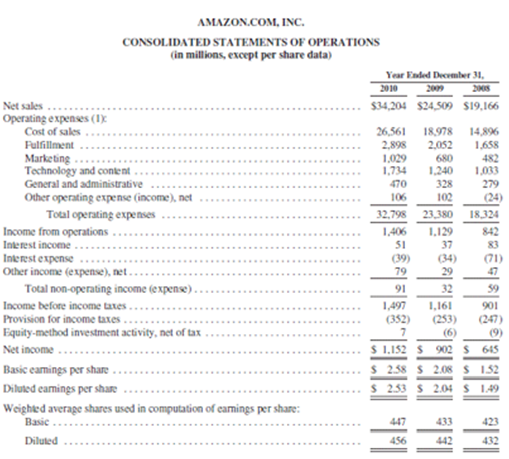
The Income Statement shows how much Revenue (i.e., sales) is being generated by a business, and also accounts for Costs, Expenses, Interest, Taxes and other items. The main purpose of this statement is to show the company’s level of profitability. The Income Statement represents items over a period of time, usually over a quarter (3 months) or a year. This statement is also referred to as the Profit and Loss Statement (P&L).
Income Statement: Key Line Items
- Revenue represents the sales brought in from selling a product or performing a service.
- Cost of Goods Sold (COGS) represents direct costs of producing goods and services that the business has sold, such as material costs and direct labor.
- Selling, General, & Administrative Expense (SG&A) represents expenses associated with selling products and managing the business. This will include salaries, shipping, insurance, utilities, rent, compensation for executives, etc.
- Depreciation & Amortization (D&A) represents the expenses associated with fixed assets and intangible assets that have been capitalized on the Balance Sheet. D&A that is directly related to production will generally be included in COGS and will be separated out on the Statement of Cash Flows (more on this later).
- Net Interest Expense represents the total Interest paid on Debt liabilities, net of the total Interest received on Cash assets.
- Tax Expense represents the amount of taxes paid.
- Net Income represents the company’s profit, which is Revenue minus all of the aforementioned costs and expenses.
Calculating Earnings Per Share (EPS)
EPS equals Net Income (after dividends on preferred stock) divided by the company’s Weighted Average Shares Outstanding. Shares Outstanding will typically be found either on the Income Statement, below Net Income, or on the first page of the most recent 10-Q or 10-K. It can also be calculated as the average of the number of common shares outstanding at the beginning of the period and end of the period (from the company’s Balance Sheet).
EPS is an extremely important metric of a company’s value: it represents the profit generated by the company for each shareholder. It will be used extensively when working through valuation techniques such as Comparable Company Analysis and Precedent Transaction Analysis.
Here is an example of an Income Statement, showing all of the discussed line items, from Amazon at the end of 2010 (Ticker AMZN):
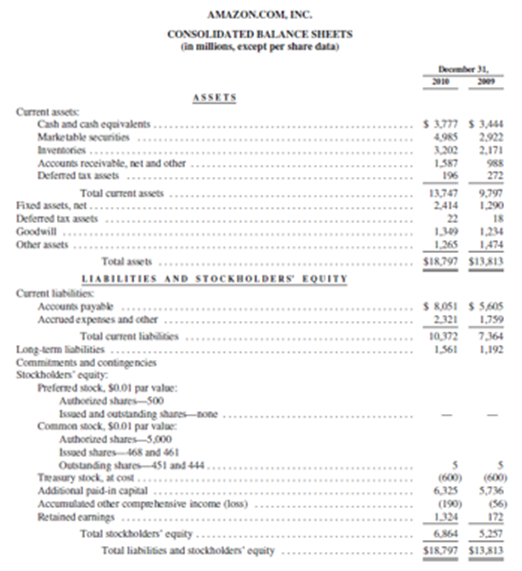
Balance Sheet
The Balance Sheet provides a snapshot of a company’s financial position at the end of a period (either quarterly or annually). The balance sheet lists company Assets, Liabilities, and Shareholders’ Equity as of a specific point in time. An important rule is that the Balance Sheet for a company must balance. In other words:
Balance Sheet Golden Rule: Assets = Liabilities + Shareholders’ Equity
This may seem like an obvious statement, but in producing financial models it is easy to make an error wherein the balance sheet does not properly balance, which will lead to serious problems with financial projection. Always make sure your balance sheet balances!
As demonstrated above, the difference between Assets and Liabilities is Shareholders’ Equity. In other words, the value of a company’s equity is equal to the value of its assets net of the outstanding obligations it has to other entities. This is, from an accounting (or “book”) perspective, what the value of a company’s shareholders positions “should be.” As we have seen, there are many reasons why a company’s equity will trade at a different valuation in the market than that derived from the Balance Sheet (usually, and hopefully, at a higher valuation than Book Value).
From the perspective of a financial analyst, the most important Balance Sheet line items fall into the following categories:
- Cash (Asset): Money owned by the company. For accounting purposes, Cash generally includes currency and coins on hand, checking account balances, and undeposited customer checks.
- Current Assets: Assets whose value is expected to translate into Cash in the near future (generally within one year). Cash is a Current Asset. Most Current Assets besides Cash are classified as “Operating Assets,” or Assets generated by the company as part of the functioning of its business operations.
- Other or Long-term Assets: Assets whose value will not translate into Cash in the near future (outside of one year). Most Long-term Assets are classified as “Operating Assets,” or Assets required by the company as part of the functioning of its business operations.
- Debt (Liability): An obligation (almost always interest-bearing) that represents borrowed money that the company must repay. Debt is usually part of Long-Term Liabilities (see below), although any portion of Debt which must be repaid within the next year will be classified as a Current Liability.
- Current Liabilities: Liabilities that a company must meet (via payment) in the near future (generally within one year). Most Current Liabilities (other than Debt) are classified as “Operating Liabilities,” or Liabilities generated by the company as part of the functioning of its business operations.
- Other or Long-term Liabilities: Liabilities that do not need to be met (via payment) in the near future (outside of one year). Most Long-term Liabilities are classified as Debt, although some qualify as “Operating Liabilities,” or Liabilities generated by the company as part of the functioning of its business operations.
- Shareholders’ Equity: The difference between Assets and Liabilities. This represents the value of the company’s assets after all outstanding obligations have been paid off. This value accrues directly to the company’s owners, or Shareholders.
Note that the difference between Current Assets and Current Liabilities is referred to as “Working Capital” or “Net Working Capital,” while the difference between Operating Assets and Operating Liabilities is referred to as “Operating Working Capital.” Working Capital is an important consideration in financial modeling—this is particularly true of Operating Working Capital. This concept will be discussed in further detail later in this training course.
Here is an example of a Balance Sheet, showing all of the discussed line items, from Amazon at the end of 2010 (Ticker AMZN):
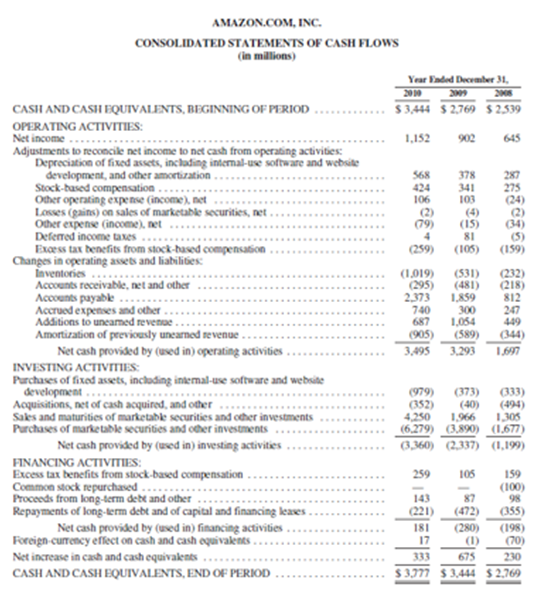
Statement of Cash Flows
The Statement of Cash Flows, or Cash Flow Statement (CFS), provides an accounting of the Cash being generated by a business, and the uses of that Cash, over a period of time. The CFS shows how Net Income (from the Income Statement) and changes in Balance Sheet items affect a company’s Cash balance.
Generally speaking the CFS will provide a clear view of the short-term viability of a business and its ability to pay its debts. If the business is not generating enough Cash from its operations to service its obligations, it should be evident from its CFS. The bottom line, therefore, is that the CFS reflects a company’s liquidity, solvency, and ongoing viability.
Three Parts of a Cash Flow Statement
All Cash flows can be broken down into one of the important categories:
- Operating Activities: The Cash generated/used by a company’s business operations. This includes earnings delivered by the company as well as payments collected from its customers. In its simplest form, Cash Flow from Operating Activities (CFO) will equal Net Income + Depreciation & Amortization – changes in Operating Working Capital.
- Investing Activities: The cash generated/used by a company’s investment in assets. Cash Flow from Investing Activities (CFI) includes the purchases of Fixed (long-term) Assets and maintenance of those Assets (Capital Expenditures), payments made for M&A activities (usually acquisitions of other companies), or Cash generated by Marketable Securities or other non-operating uses of Cash.
- Financing Activities: The Cash generated/used by a company’s financing of its operations. Cash Flow from Financing Activities (CFF) includes the Cash inflows from shareholders and lenders as well as the outflows of dividends or sales of stock. Items found in this line item will include: Dividends Paid, Cash raised via the sale of Common Stock, Cash proceeds from Borrowings (Debt), and repayment of Debt obligations.
The SCF is greatly affected by the change in Balance Sheet line items. When Assets on the Balance Sheet fall, Cash typically rises. For example: if “Accounts Receivable” (an Operating Current Asset on the Balance Sheet) falls, this is because a customer had paid its bill and hence Cash increases. Simultaneously, the Accounts Receivable line item decreases by the same amount. By contrast, when Liabilities and Equity rise, typically so does Cash. For example, if a company issues Debt (a Liability on the Balance Sheet), Cash will rise by the same amount as the value of the loan taken out. Similarly, if a Company repurchases common shares outstanding, Cash will decrease by the same amount as the value of the Equity being retired in the transaction.
In summary, Assets are uses of Cash while Liabilities and Equity are sources of Cash. This important concept will come into play directly in building financial models that help determine a company’s value.
Here is an example of a Statement of Cash Flows, showing all of the discussed line items, from Amazon at the end of 2010 (Ticker AMZN):
How Financial Statements Tie Together
Now that you are familiar with the three main Financial Statements, we can ascertain how they all tie together. In short, the Financial Statements are interconnected in many places. In particular, practically every line item on the SCF is connected to one of the two other statements.
Connected Line Items on the Financial Statements
While this list is not exhaustive, it covers most of the basic interconnections across a company’s Financial Statements:
- Income Statement:
- Depreciation: Fixed Long-term Assets (Balance Sheet) are depreciated over a period of time; this is expensed on the Income Statement.
- Amortization: Some other Long-term Assets (Balance Sheet) are amortized (similar to being depreciated) over a period of time; this is expensed on the Income Statement.
- Balance Sheet:
- Cash: Ending Cash on the Cash Flow Statement flows into Cash within Current Assets on the Balance Sheet.
- Shareholder’s Equity: Net Income (Earnings from the Income Statement) after Dividends Paid flow into Retained Earnings in Shareholder’s Equity.
- Cash Flow Statement:
- Beginning Cash: This is equal to the previous period’s ending Cash balance on the Company’s Balance Sheet.
- Net Income (CFO): Equals Net Income found on the Income Statement.
- Depreciation (CFO): Depreciation is a (generally unlisted) component of COGS and other expense items found on the Income Statement; it is added back because it is a non-Cash expense. In other words, the company did not actually spend the money being represented by Depreciation during the period—that Cash expense was recorded as a Capital Expenditure in a prior period. That value is allocated over a long time horizon, and Depreciation in any given year represents that year’s ascribed value of the Assets being used.
- Amortization (CFO): Amortization is a (generally unlisted) component of COGS and other expense items found on the Income Statement; like Depreciation, it is added back because it is a non-Cash expense. The Cash was generally spent in a prior period, usually as part of an acquisition.
- Capital Expenditures (CFI): This is money spent on Long-term (Fixed) Assets on the Balance Sheet. The change in these Assets should equal Capital Expenditures minus the year’s Depreciation on these Assets.
- Repayments of and Proceeds from Long-term Debt (CFF): This is money raised from, or used to repay, Long-term Debt obligations (Liabilities) on the Balance Sheet. (Note that mandatory Debt repayments coming due in the near future are moved from Long-Term Liabilities to Current Liabilities on the Balance Sheet as their repayment dates draw near.)
- Ending Cash: This is equal to the current period’s ending Cash balance on the Company’s Balance Sheet.
How Does Depreciation Affect the Financial Statements?
Depreciation is an especially tricky line item because it affects all three Financial Statements, but is often not broken out directly in the Income Statement even though it is an annual expense. Here is a summary of how Depreciation affects all three Statements (a similar description also applies to Amortization):
- Income Statement: Depreciation is an expense on the Income Statement (often buried inside displayed line items such as COGS). Increasing Depreciation will increase expenses, thereby decreasing Net Income.
- Cash Flow Statement: Because Depreciation is incorporated into Net Income, it must be added back in the SCF, because it is a non-cash expense and therefore does not decrease Cash when it is expensed.
- Balance Sheet: Net Fixed Assets (generally Plant, Property, and Equipment) is reduced by the amount of the Depreciation. This reduces Fixed Assets. It also reduces Net Income and therefore Retained Earnings (Shareholders’ Equity) as well. As discussed previously, Depreciation is a non-Cash expense. Therefore, increases or decreases to Depreciation will not impact Cash directly.