In this chapter we will cover five key topics:
- Comparable Company Analysis (aka “Comps”) Overview
- Peer Universe
- Market Capitalization & Enterprise Value
- Historical & Projected Financials
- Spread Multiples
Comparable Company Analyses (Comps) Overview
What are Comps?
Comparably Company Analyses, or “Comps”, are a relative valuation technique used to value a company by comparing that company’s valuation multiples to those of its peers. Typically, the multiples are a ratio of some valuation metric (such as equity Market Capitalization or Enterprise Value) to some financial performance metric (such as Earnings/Earnings Per Share (EPS), Sales, or EBITDA). (An astute reader will note that Sales and EBITDA are enterprise-wide metrics, and thus should be used with Enterprise Value, while Earnings/EPS is an equity-related metric, and thus should be used with Market Capitalization.) The basic idea is that companies with similar characteristics should trade at similar multiples, all other things being equal.
Why use Comps?
Comps are relatively easy to perform, and the data for them is usually relatively widely available (provided that the comparable companies are publicly traded). Additionally, assuming that the market is efficiently pricing the securities of other companies, Comps should provide a reasonable valuation range, while other valuation methods such as DCF are dependent upon an entire array of assumptions.
These factors make Comps one of the most widely-used valuation techniques in practice. Investment bankers, sell-side research analysts, private equity investors, and other market analysts all use Comps. They do have their disadvantages, however.
Comps Advantages and Disadvantages
|
PROs and CONs of Using Comps
|
|
|
PROs
|
CONs
|
|
|
Performing a Comparable Companies Analysis
Remember C.V.S.
When doing a Comps analysis, a useful checklist of things to do has a mnemonic that is easy to remember: “C.V.S.”
- Confirm relevant peer universe.
- Validate key fundamental metrics.
- Select appropriate multiple for valuation.
The appropriate selection of a relevant peer universe is critical for a Comps analysis, because it plays a significant role in the valuation of the target company. For example, a company could sometimes be compared across two different industries due to the nature of the business (e.g. an internet retail company). Similarly, some comparable companies might need to be ruled out or adjusted because it owns businesses across several different industry groups. Peer universe selection is therefore somewhat subjective.
When doing a Comps valuation, the analyst can choose to use either trailing (historical) performance metrics, or future (forecast) performance metrics. (Note that many analyses will look at both historical and future metrics.) In general future metrics are preferred, but one needs to be careful with this. For example, projected EBITDA and projected Earnings/EPS are subject to all kinds of potential pitfalls associated with forecasting. The forecast numbers may end up being significantly off.
Additionally, when performing a Comps analysis you may want to adjust the performance for various one-time charges and non-recurring items (such as a sale of assets, a one-time legal expense, or a restructuring charge). It is important that all companies in the analysis use “clean” numbers to provide an “apples-to-apples” comparison. This becomes especially difficult when using future performance metrics, as the non-recurring items may be as-yet unknown.
Key Assumptions & Projections:
To quickly recap on key assumptions and projections that we need to make when performing a Comps analysis:
- Peer Universe: A selection of competitor/similar companies used to determine a benchmark valuation.
- EBITDA: Historical & projected Earnings before Interest, Taxes, Depreciation & Amortization.
- EPS: Historical & projected Earnings Per Share.
Types of Multiples
There are various types of multiples that can be used in a Comps analysis. In general, multiples can be classified in two broad categories: Operating multiples and Equity multiples. Operating multiples refer to the operating results of the business as a whole while Equity multiples refer to the value created from the company that is available to equity/shareholders.
Typical multiples for Comps include:
- EV/Sales: The Enterprise value of the company divided by Sales/Revenue (Operating multiple)
- EV/EBITDA: The Enterprise value of the company divided by EBITDA (Operating multiple)
- P/E: Price/Earnings ratio for a company (Equity multiple). This is either calculated as Share Price ÷ EPS, or Market Capitalization ÷ Earnings (they are mathematically equivalent).
- P/B: Price/Book ratio for a company (Equity multiple). This is either calculated as Share Price ÷ Book Value per Share, or Market Capitalization ÷ Shareholders’ Equity (they are mathematically equivalent).
- P/(Levered) Cash Flow: Price/Cash Flow ratio for a company (Equity multiple). This is either calculated as Share Price ÷ Levered Cash Flow per Share, or Market Capitalization ÷ Levered Cash Flow (they are mathematically equivalent).
Note that for Operating Multiples we use Enterprise Value as the numerator of the calculation, while for Equity Multiples, we use Market Capitalization as the numerator. You should generally not use EV for equity-related performance metrics, nor should you use Market Capitalization for enterprise-related performance metrics.
Recap on Operating multiples:
- The most commonly used Operating multiples are EV/Sales and EV/EBITDA.
- Operating multiples ignore financial leverage (Debt) and typically ignore Depreciation & Amortization.
- They value the total company versus common stock (Equity) only.
- They are frequently used by investment bankers, private equity investors.
Recap on Equity multiples:
- The most commonly used Equity multiples are P/E, P/B, and P/Cash Flow (Levered).
- Equity multiples ignore cash flow to Debt holders.
- They are frequently used by investment bankers and equity analysts.
In this training course, the two most common multiples, EV/EBITDA (an Operating multiple) and P/E (an Equity multiple), will be used. However, it is still worthwhile to be aware of other kinds of multiples, as they are frequently used.
When are Price/Sales multiples used?
Price/Sales multiples are typically used for companies with negative, highly volatile, or abnormally high/low EPS. For example, fast-growing companies that have no earnings yet or negative earnings (because they are spending a lot of money to grow or have not yet reached critical mass for sales) may be valued based upon multiples of Sales. A common advantage of using Price/Sales is the general stability and lower accounting distortion afforded by sales numbers. However, sales numbers can be manipulated through revenue recognition practices and growth companies can be given high valuations regardless of having no earnings or cash flow. Additionally, using Sales as a basis for valuation does not take into account the profitability of those Sales figures. Some companies, for example, may be able to turn a large profit margin on incremental sales, while others might have very narrow profit margins.
When are Price/Book multiples used?
Price/Book multiples are often used to value financial services companies since their balance sheets are primarily composed of liquid assets that often approximate market values. These multiples can also be used for companies with no earnings, highly variable earnings or companies not expected to continue as a going concern. Unfortunately, for most companies in most industries the Price/Book ratio is highly idiosyncratic, because the Book Value is a function of all past business activities (literally since the company’s founding or most recent recapitalization). Therefore Price/Book ratios can swing wildly depending on each company’s circumstances.
What are Cash Flow multiples?
Cash Flow multiples use an estimate of Cash Flow, such as EBITDA, Operating Cash Flow, Free Cash Flow, and Levered Free Cash Flow, as a valuation indicator. These multiples are often superior to Earnings multiples because they ignore a lot of the idiosyncrasies of accrual-based accounting and are therefore less subject to management manipulation. (Note that EBITDA ignores Capital Expenditures, which are indeed a Cash outflow. Thus in many instances Comps will use (EBITDA – Capital Expenditures) as the Cash Flow estimate.)
Many times in practice, the reciprocal of these multiples are used to produce Cash Flow Yields, which are compared against treasury yields and dividend yields as a valuation yardstick.
Pitfalls to Avoid When Using Comps
Avoid these typical pitfalls when building a Comps analysis:
- Inappropriate peer universe selected
- One-off and recurring items included in historical/projected EBITDA and EPS
- Wrong multiple selected for valuation
Again, remember the mnemonic, “C.V.S.”
- Confirm relevant peer universe.
- Validate key fundamental metrics.
- Select appropriate multiple for valuation.
Steps to remember for executing a Comps valuation
- Select a Peer Universe: Pick a group of competitor/similar companies with comparable industries and fundamental characteristics.
- Calculate Market Capitalization: It is equal to Share price × Number of Shares Outstanding.
- Calculate Enterprise Value: Market Capitalization + Debt + Preferred Stock + Minority Interest (less common) – Cash.
- Historical & Projected Financials: Use historical financials from filings and projections from management, sell-side equity analysts, etc.
- Spread Multiples: Using Market Capitalization, Enterprise Value and historical/projected financials, spread (i.e., calculate) EV/EBITDA and P/E multiples.
- Value Target Company: Pick the appropriate benchmark valuation multiple for the peer group, and value the target company based on that multiple. Typically, an average or median is used.
Sources of Information Needed for Comps
- Peer Universe: Company filings, Research Reports, Bloomberg, or FactSet
- Historical Financial Results: SEC.gov has company annual reports (10-K), Quarterly reports (10-Q), and (where available) investor Prospectuses.
- Financial Projections: Management estimates, sell-side equity analyst estimates, and/or internal estimates generated by the bank
Peer Universe
In order to spread (calculate) comps, you must find similar companies that operate in the same industry as the company you are trying to value.
Once again, remember “C.V.S.”: Confirm relevant peer universe. Validate key fundamental metrics. Select appropriate multiple for valuation.
Picking a Peer Universe
Choosing a relevant peer universe for valuation is usually done in one of two ways:
- Your investment banking deal team or Managing Director (MD) will instruct you as to which comparable companies to use. For example, the MD might say, “Use the following 10 companies in this analysis.” The Management team of the company usually has the best insight into the true competition in the marketplace, and is therefore usually the best resource, but it is the job of investment bankers to figure this out on their own.
- Run a search using bank resources (such as Bloomberg, FactSet, and Analyst Reports; see below) and screen the result set for relevance.
What resources can be used to find peers?
Some of the best resources include the following:
- Company Filings: A primary source for finding peer companies is in company filings (10Ks, 10Qs, Prospectuses) in the “Competitors” section. These filings can be found at the SEC website (http://www.sec.gov/).
- Sell-side Equity Analyst Research Reports: Sell-side research reports are an excellent source of comparable companies. Usually, an initiation report or a lengthy industry report will have a fairly complete list of peer companies. This provides a good point of reference for what other Wall Street analysts believe to be the target company’s relevant peer universe.
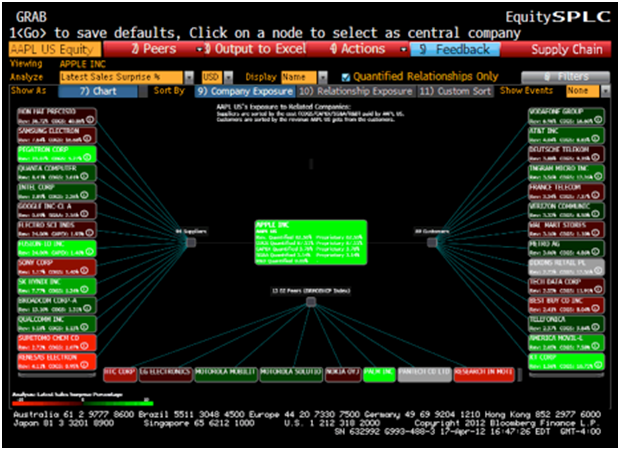
- Bloomberg: A very useful tool for finding peers is the Supply Chain page on Bloomberg for a given company. To use this tool, type <<Ticker>> Equity SPLC <GO>. The page provides a quick snapshot of a company’s suppliers, customers and peers. Below is an example sample screen shot for Apple Corporation (AAPL). The peer companies are shown at the bottom of the page. The suppliers and customers should also be examined for possible inclusion in the peer universe:
It is important to note that you will almost never find a perfect comparable company, because companies are very similar to snowflakes—no two are ever exactly alike. However, you will be able to narrow down your search using the characteristics such as Sector, Products & services sold, Customer base, Distribution channel, and Geography. Some examples of nearly perfect comparable companies are: Pizza Hut and Domino’s, Home Depot and Lowe’s, or Pepsi and Coca-Cola. These are very similar (not identical!) companies that overlap very well in terms of all of the relevant factors: geography, products/services, customers, and distribution channel.
Market Capitalization (Market Value) & Enterprise Value
Once you have selected a relevant peer universe, the next step is to find the necessary financials to spread (calculate) your multiples. Bankers will typically use database resources such as Capital IQ and FactSet in order to pull this information quickly. This should be checked against the actual GAAP data released in company 10-Qs and 10-Ks filed with the SEC, because these datasets often include errors or questionable assumptions/adjustments. (In that respect, it often is best to gather the data from the SEC directly when running a comparables analysis.)
Necessary financials typically include the following information:
- Market Capitalization (Stock Price × Shares Outstanding)
- Enterprise Value (Market Value + Net Debt + Preferred Stock + Minority Interest – Cash)
- Earnings per Share (EPS, Net Income ÷ Shares Outstanding)
- Earnings before Interest, Taxes, Depreciation, and Amortization (EBITDA)
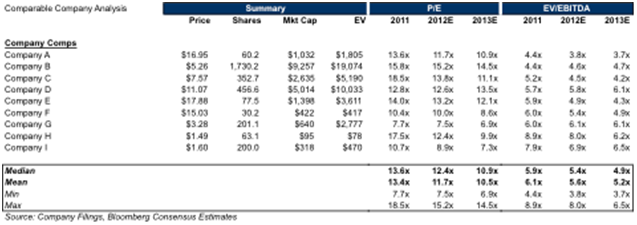
Here is an example of a final output from a Comps Analysis. The key financial inputs to this analysis will then be discussed:
Market Capitalization (Market Value)
Market Capitalization represents the total equity value of a company, and does not reflect management’s allocation of capital structure among all forms of financing (such as equity, debt, preferred stock, etc.). It is a useful representation of valuation for common stock investors because they typically do not purchase a majority-owned stake in the company, and therefore only have access to the earnings available to common shareholders.
The formula for calculating Market Capitalization is:
Stock price is the price per common share. It is obtained using any financial software (Thomson, Bloomberg, CapIQ) or reliable Internet pricing service (Yahoo Finance, Google Finance). (Be sure to verify that price is the closing price as of the analysis date.)
There are two types of Shares Outstanding: Basic and Diluted. Basic shares outstanding can be obtained from the first page of a company’s 10-K or 10-Q. Diluted shares outstanding account for the conversion of options, warrants and convertible preferred stock and prevents a possible underestimate of valuation caused by using basic shares outstanding. Diluted shares outstanding can be obtained from the EPS footnotes of a company’s financials, and can also be calculated directly using footnotes to the financials that list management stock options as well as warrants and convertible preferred stock.
Enterprise Value
Enterprise Value (EV) represents the total value of a company and incorporates all of the components of management’s allocation of the capital structure–equity, debt, preferred stock, etc. It is a useful representation of valuation for strategic and private equity investors because it represents the takeover value of the company (prior to any control premium for the acquisition).
The formula for calculating EV is:
Let’s look briefly at what each of these components of EV refer to and how they are calculated.
Market Capitalization
- Market Capitalization, as defined earlier (Stock Price × Shares Outstanding), refers to the total equity value of the company.
- It can be defined using Basic shares outstanding or Diluted shares outstanding.
Debt
- Includes short and long-term debt, as listed on the company’s balance sheet, as well as current portions of long-term debt (listed in the Current Liabilities section of balance sheet).
- Each line item of debt will generally be footnoted with specific terms of the debt arrangement given.
Preferred stock
- Listed in the Equity section of the balance sheet, Preferred Stock is a special tranche of the capital structure that has some debt-like qualities (like paying interest) and some equity-like qualities (often convertible into shares, and sometimes has voting rights alongside common equityholders).
- Only include: mandatorily redeemable and convertible preferred where conversion price > stock price.
Minority Interest (What is it and why do we include it?)
- Minority interest is the equity interest that other entities have in a division (subsidiary) of the company. This will occur whenever the company owns more than 50% but less than 100% of the equity in a subsidiary. The company has control over the subsidiary, but doesn’t own all of it.
- These subsidiaries will have financial results that are fully consolidated into the company’s financial results. Therefore, financial results such as Sales, EBITDA, Earnings, etc. that are attributable to other owners will be included in the valuation metrics. The numerator of the calculation should therefore include these minority stakes in the subsidiaries as well.
- For accounting purposes, Minority Interest is treated as a liability on the Balance Sheet and this liability amount should be added into the EV calculation.
Why is Cash deducted in the Enterprise Value calculation?
- Cash is subtracted out of Enterprise Value because excess Cash is considered a non-operating asset, and could be used to pay down part of the company’s debt immediately, which would reduce the Enterprise Value of the Company. (Note that the definition of “excess cash” is somewhat loose, as it refers to cash that is not needed to conduct the operations of the business; a simplifying assumption in most cases is to count all Cash as excess Cash.)
Historical & Projected Financials
Two fundamental metrics will always need to be calculated and input into the analysis before the Comps can be spread: 1) EPS and 2) EBITDA. These form the denominators of the multiples used in the analysis. Each of the examples given below consist of a historical financial result (2011 in this example) and projected (2012E & 2013E) financial result.
Historical EPS
Historical EPS can be obtained directly from a company’s income statement in the 10-K, 10-Q or most recent earnings press release. Note, however, that Historical EPS will often need to be adjusted for non-recurring items such as one-off charges (e.g. restructuring), extraordinary gains/losses, etc. Often, management details adjustments in company press releases. These press releases can be found in the Investor Relations section of company website, or via footnotes or the Management Discussion & Analysis (MD&A) section of 10-K and 10-Q filings.
These items need to be added on a pre-tax basis for “above-the-line items” (items that appear before the Taxes line item in financial statements, such as Revenue, Gross Profit, and Operating Profit). If the adjustment is to a “below-the-line” item, use the effective tax rate to determine the relevant pre-tax amount. For adjustments to Net Income, use the effective tax rate on all pre-tax items to determine the appropriate after-tax amount.
Projected EPS
Projected EPS can be derived in several different ways:
- Management estimates
- Consensus analyst estimates from aggregators such as Thomson One, Capital IQ or Zacks
- Individual sell-side research analysts
- Your own financial model (this is rare for an initial cut at a Comparable Companies Analysis)
EBITDA
EBITDA is calculated using the following formula:
Spread Multiples
The next step after collecting the relevant peer universe and locating the necessary financials for each peer is to start “spreading” the key trading multiples—in other words, calculating and displaying them in an easy-to-read fashion, typically in a spreadsheet. This approach allows users to easily see the valuation calculations across your custom-defined peer universe.
The Comps table should include Mean, Median, Min and Max statistics for each metric in each year to provide a valuation range for the company you are valuing.
Value Target Company
The final step, once multiples for the peer universe have been spread, is to use this information to determine valuation. With the valuation metrics calculated as described, we can use the multiples of the peer universe to determine the valuation of the target company.
Let’s look at an example:
Company F has an estimated EPS of $1.50 in 2012. How much is its stock worth using the Comps given?
The calculation is as follows:
- The Comps set given is trading at 12.4x (median) 2012E Earnings Per Share.
- 12.4 × $1.50 = $18.60. (P/E multiples gives us Market Value Per Share, so we are finished!)
Company F has an estimated EBITDA of $77 (million) in 2012. How much is its stock worth using the Comps given?
The calculation is as follows:
- The Comps set given is trading at 5.4x (median) 2012E EBITDA.
- 5.4 × $77 million = $415.8 million. (This is the Enterprise Value; we need to back out Net Debt to get to Market Capitalization. The difference between the EV and Mkt. Cap. given for Company F must equal Net Debt.)
- $415.8 million – ($417 million – $422 million) = $415.8 million + $5.0 million = $420.8 million. (This is Market Capitalization; we need to divide by Shares Outstanding to get the Share Price.)
- $420.8 million ÷ 30.2 million = $13.93.
Valuation Conclusion
Based on comparable company analysis, Comp F is worth between $13.93 – $18.60 based on 2012E P/E and EBITDA multiples of public competitors.
←Financial Statement AnalysisDiscounted Cash Flow Analysis→